CalcIt debugger is a source level debugger for CalcIt code written in Expressions, UDFs and scratchpad/Application editors. The user is able to step through his\her code line by line, insert breakpoints and set watch expressions. The debugger is comprised by a special window where the user has to drop the code he\she wants to debug. The Debugger window has a toolbar, a code area and a watch expressions area.
 Run (F9). Runs code until
the end of code execution or until the first breakpoint found.
Run (F9). Runs code until
the end of code execution or until the first breakpoint found.In code area we drop code first to set breakpoints and second to step through its text line by line.
We can insert breakpoints only in lines that start with the plus (+) symbol. To set (or remove) a breakpoint we click the plus (+) symbol.
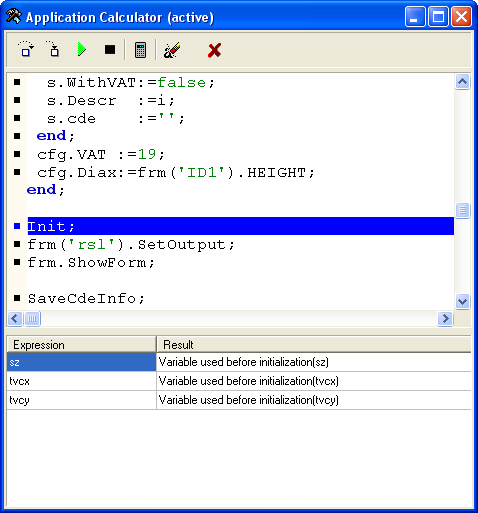
When the code in the code area is executed then there is a line currently to be executed. This line appears with white text in blue background. Lines with breakpoint appear as white text in red background.
A watch expressions is a piece of CalcIt code in which all the variables of
the code executed in debug mode are accessible. Every time we press ![]() or step to the next line, these expression are reevaluated. So this permits us
to watch the values of variables and helps to find errors in code logic. We also
can change the value of a variable the same way the code that owns it can.
or step to the next line, these expression are reevaluated. So this permits us
to watch the values of variables and helps to find errors in code logic. We also
can change the value of a variable the same way the code that owns it can.
Watch expressions are entered in the lower part of the Debugger window. This part is comprised by a two columns list, "Expression" and "Result". When the cursor is in Expression column and we press RETURN, a new line is inserted. In "Expression" column we can enter CalcIt code. This code can process in any way variables of the code in Debug mode. Any result this code returns it appears in the column "Result".
To delete a watch expression line we delete all its text with BACKSPACE. When the line becomes empty and press BACKSPACE the whole line is removed.
NOTE: Automation variables cannot be accessed in watch expressions.
To debug Expressions first we have to make visible Debugger's
special window. This can be done by ![]() at main toolbar or pressing F5.
at main toolbar or pressing F5.
Second we select an expression and drag & drop it to the code area. Alternatively we can drag & drop a Calculations bounded in the expression.
In code area we can insert breakpoints. We click the plus (+) symbol in the start of the line in which we want to insert a breakpoint.
To start debugging we must execute a Calculation, bounded to the Expression in debug mode. In Calculations list we select a Calculation clicking on it and we press F8 or we do the same using Calculations list pop up menu. The execution starts and will stop at the the first breakpoint encountered or at the normal code termination.